Marketing Marketing is a complex field which could have its own playbook. This section focuses on the part of marketing closest to sales: demand generation.
The world's shortest marketing primer Copy link
Marketing lives at the intersection of three things: Copy link

Business benefits – why buy a product or service? Copy link
It provides a solution to business problems, it’s better/cheaper/faster and there are customer testimonials as proof

Product differentiation – why buy your product or service? Copy link
This comes down to your high-level product positioning, agenda-setting your differentiating features and mapping unique features to customer problems

Buyer priorities – why give my product the time of day? Copy link
The best marketing talks to customers about what’s important to them. Successful marketers research the areas which top their customers’ pain point list and they map these problems to their company’s solutions
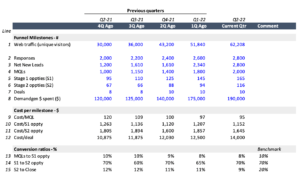
It’s easy to get lost in numbers when looking at marketing funnel metrics so it’s best to focus on cost-per rows, particularly cost per Stage-2 (S2) opportunity. It’s also best to look first at three high-level conversation rates: MQL to S1, S1 to S2, and S2 to close.
These rates effectively measure both the quality of the inputs and the ability of the organisation to convert them. Marketing owns MQL to S1, SDRs own S1 to S2, and sales own S2 to close.
Note this is a milestone-based analysis, meaning we are counting how many things (e.g. leads, opportunities) pass milestones (e.g. stage-1, stage-2) within a given time period. Cohort-analysis is typically more meaningful but requires the passage of time and is thus a more lagging indicator.
Lead nurturing and recycled MQLs Copy link
Sometimes a lead may qualify as an MQL, get passed to SDR, but then be disqualified Copy link
You have probably found the right person at the right company at the wrong time. This suggests you should nurture them until they are ready.
Nurture programmes typically have one or both of two specific goals Copy link
The first is to remain top-of-mind with a customer so they think of your company when they are ready to buy. The second, more ambitious goal of nurture, is to accelerate a customer's buying time frame, typically achieved by emphasising the benefits of acting now and/or the risks of waiting until later.
Competitive nurture programmes are designed to win back customers Copy link
A special type of nurture track is dedicated to nurturing customers who, in the end, didn't select your company. In such situations, smart sellers recommend the buyer "try and buy" the competition via a short-term contract and then place them on a dedicated nurture track, designed to win them back.
Many companies wait too long to formalise nurture programs Copy link
Too many companies just throw leads back into the database, send them a monthly newsletter, and invite them to local events. While better than nothing, this is simply database marketing, not nurture marketing.
The ‘recycled’ MQL Copy link
When a lead emerges from a nurture programme it is typically called a recycled MQL. When good nurture programmes are in place, 20-50% of MQLs may be recycled. This is ultimately why you shouldn't wait too long to set one up and measure it on recycled MQLs.
Nurture programmes often take one of two forms Copy link
They can be SDR-led, for high-value leads automated by tools such as Outreach. Alternatively, they are marketing-led, for normal leads automated by tools such as Hubspot.
Most people think of marketing as a linear funnel where leads flow from top to bottom.
This is a particularly good way to think about it where simple sales models apply (e.g. basic ecommerce). With more complex models, it’s better to think of marketing as a popcorn machine.
Marketing and SDRs keep working on them until they pop!
Example complex models include: Copy link
- Multiple buyers
- Each with multiple touches
- Engaging marketing, sales, and partners
- Over a long period of time
- Cycling and recycling as MQLs
Marketers think of campaigns as happening within and across various channels. Charts like those above are often used to determine channel effectiveness - i.e. to find which half of your marketing budget is wasted.
While this is a useful exercise, it is important to understand how credit is attributed to a channel, especially when multiple people are engaging in multiple marketing, sales, and partner touches over time.
These charts can backfire when the audience doesn't understand the data that's being presented. For example, measuring field marketing programmes such as executive dinners via first-touch attribution is likely to result in a poor showing as these are are designed to advance existing deals and rarely, if ever, generate new leads.
This is why it's important marketers clearly explain what's being presented ahead of time. They should then complement this with a quarterly analysis of closed deals to show everyone the reality of their average sales cycle in terms of contacts, time, and touches.
Attribution - the Achilles' Heel of measurement Copy link
Imagine a situation where a person has multiple marketing touches before becoming an opportunity. e.g. Copy link
- They clicked on a search ad
- They replied yes to a follow-up email webinar invite
- They saw a demonstration at a tradeshow booth
Attribution is about how you credit these marketing campaigns. There is no good answer to the attribution problem, but in general, people use one of three approaches: Copy link
- First-touch attribution – gives all credit to the search ad
- Last-touch attribution – gives all credit to the trade show
- Points-based attribution – accumulates points for each activity and credits back on a pro rata basis
Founders need to understand what they're looking at and act accordingly. Copy link
Don’t automatically cancel the trade show booth if sales loved the show. For instance, trade shows can help build on first-touch attribution and help move an audience of already-identified buyers towards a deal, instead of just finding new buyers.
Four Pipeline Sources Copy link
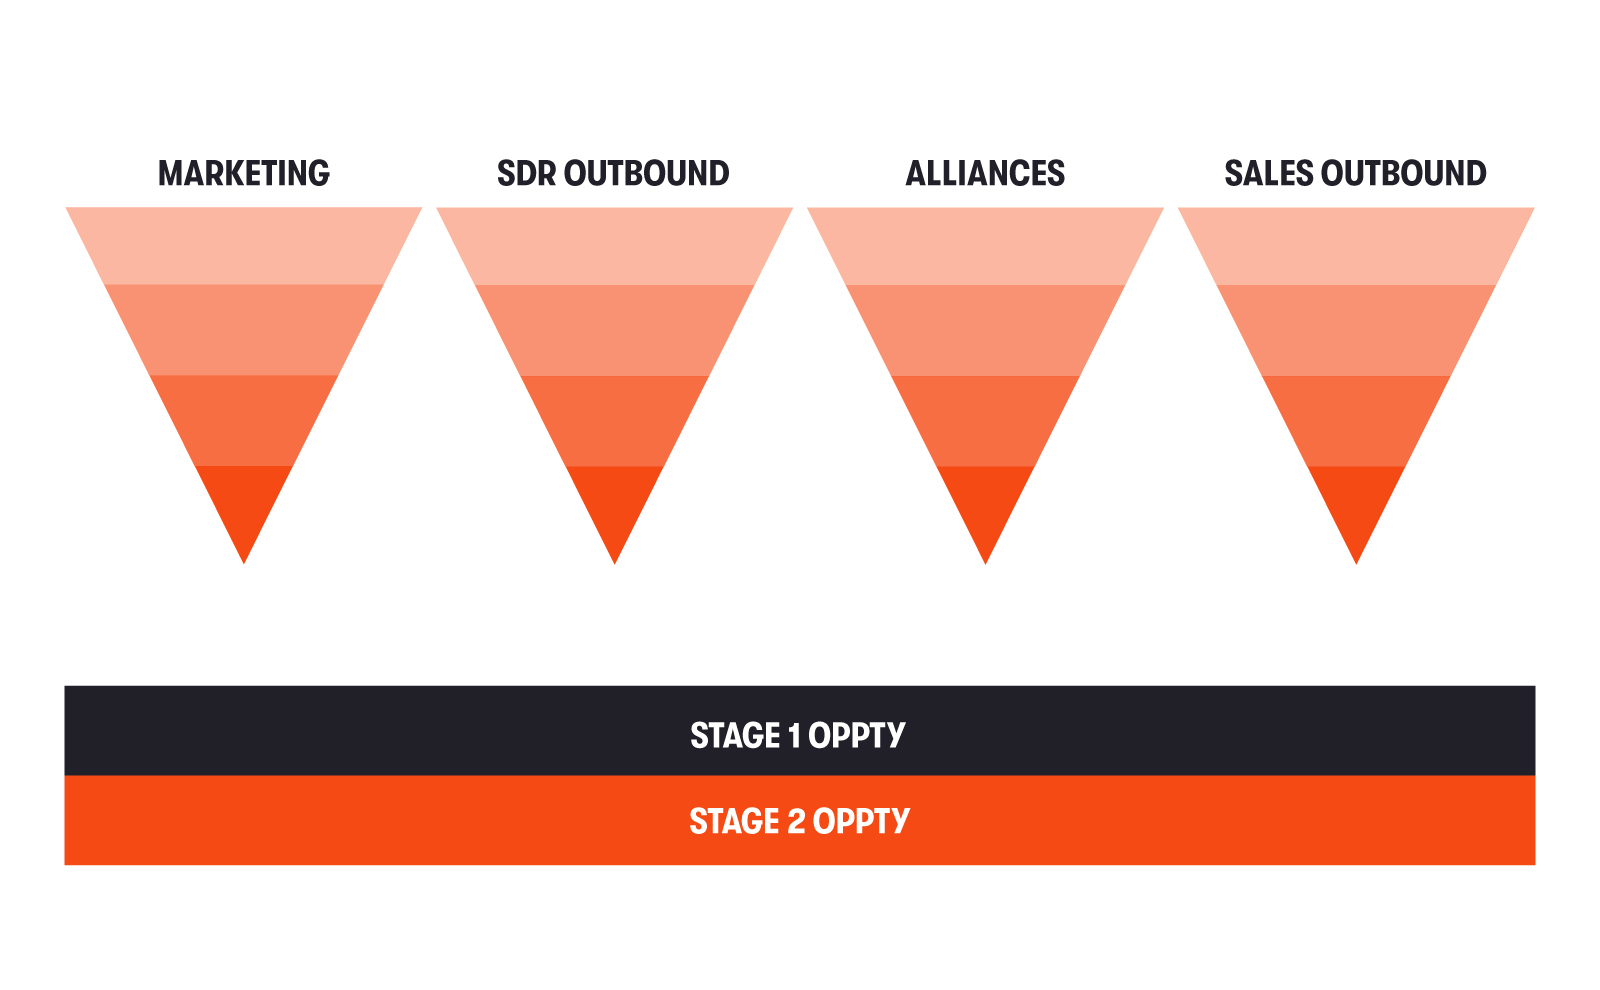
There are generally four sources of pipeline. You should set opportunity generation targets for each of them. Copy link
As SaaS companies, marketing usually generates between 50% and 90% of the sales pipeline.
With account-based sales and marketing, outbound SDRs typically generate between and 10% and 30%.
Alliances can generate highly-qualified opportunities, usually accounting for between 10% and 30%.
Most sales managers want sellers, particularly in enterprise models, generating between and 10% and 20%.
Note that while it's fine for executives to think in terms of percentages, it's important to assign quarterly OKRs based on actual targets (i.e. generate 225 Stage-1 opportunities). This focuses people on a more tangible goal (opportunity count) rather than percent mix or pipeline dollars and avoids corner cases (e.g. when the target is missed but the mix is correct).
Pipeline progression Copy link

Copy link
The above pipeline tracking chart avoids the problem of simply tracking total or rolling four-quarter pipeline (e.g. a back-loaded pipeline looks fine on overall coverage, but leaves you with a short-term struggle).
This chart shows a pipeline snapshot every quarter, its distribution over time (by close date), and shows the coverage ratio to the sales target (i.e. pipeline/target).
This chart is best read by first looking at this– and next–quarter coverage to spot any urgent problems.
Then it should be read diagonally: the 1/1/21 N+2 quarter pipeline becomes the 4/1/21 next-quarter pipeline which becomes the 7/1/21 this-quarter pipeline.
Product-led growth: trials as the fifth pipeline source Copy link
Product-led growth (PLG) companies generate large bases of users using trial, free, or discounted product. Open-source companies do the same thing via free or community editions. In these models, the default marketing call-to-action switches from "get demo" to "start trial."
Cross-functional growth teams (e.g. product, product marketing, design, sales) work together to continually improve trial conversion efficiency - from defining gates in the product to user monitoring to drive SDR outreach.
People who use the product frequently, or in a certain way, become product-qualified leads (PQLs).
Marketing thus has a dual role in PLG companies: Copy link
- Driving people to trials
- Working with the growth team to drive trial conversion into customers or PQLs
In PLG companies, trials become the fifth (and typically primary) pipeline source Copy link
To learn more about marketing Copy link
- The Hubspot Marketing Blog by Hubspot
- Digital Marketing Blog by Neil Patel
- The Content Marketing Institute blog by the CMI
- The Buffer Social Media blog by Buffer
- Kellblog on marketing by Dave Kellogg
- Product-Led Growth by OpenView Partners
- The B2B Marketing Handbook by Robert Bly


